



Rebuilding the same reporting deck every week gets old fast. Half the time goes on copying numbers out of Search Console and Analytics, the other half on formatting a slide nobody reads closely anyway. Here’s a free template to start from right now, and a real way to make it update itself using Claude Code, Anthropic’s command-line coding tool, not a vague “AI automates your reporting” claim.
Worth being straight about what “automated” means here before anything else: it means Claude Code run on a schedule, pulling fresh data and updating the sheet. It isn’t something that refreshes itself with no trigger at all, and any page telling you otherwise is skipping the part that actually makes it work.
Grab the template first
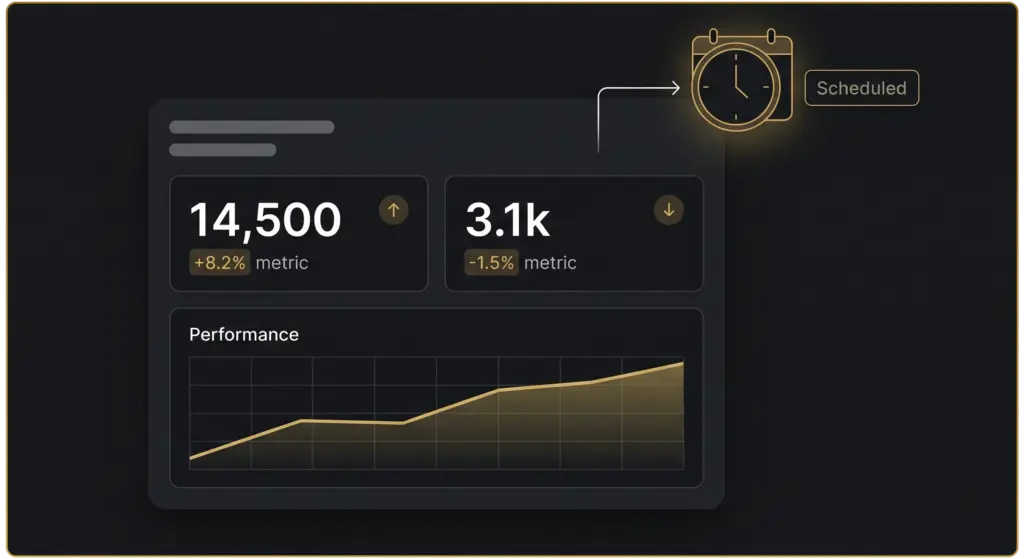
The template’s attached to this post: a workbook with four tabs, GSC Data and GA4 Data for pasting your exports into, a Trends tab that totals them by month automatically, and an Overview tab showing the latest month against the previous one, clicks, impressions, average position, sessions, and conversions, each with the change and percentage shift already calculated.
It ships with a few example rows so you can see the format and the formulas working before you paste your own data in. Delete those, paste your real export in the same columns, and the Trends and Overview tabs update on their own, no formula editing required.
Here’s what the Overview tab actually shows once real numbers are in, using the template’s own example data (a dummy coffee-shop review site, nothing tied to a real client):
| Metric | Latest month | Previous month | Change |
|---|---|---|---|
| Organic clicks | 71 | 59 | +12 (+20.3%) |
| Impressions | 1,015 | 965 | +50 (+5.2%) |
| Average position | 6.5 | 6.2 | +0.3 (a slight drop, since lower is better here) |
| Sessions | 113 | 94 | +19 (+20.2%) |
| Conversions | 8 | 5 | +3 (+60%) |
Every number there is a live formula pulling from the Trends tab, not a typed-in result, change the data in the GSC Data or GA4 Data tabs and this table updates itself.
What actually belongs on an SEO dashboard
Five numbers matter more than the rest: organic clicks, impressions, average position, sessions, and conversions. That’s it. Every one of them ties back to a real question: are people finding the page, are they clicking through, are they landing on something that actually works for them.
Impressions and average position answer whether the page shows up at all, and where. Clicks answer whether it’s actually convincing enough to get chosen once it does show up. Sessions confirm the visit actually happened the way GSC’s click data suggests, since the two tools measure slightly differently. Conversions answer the only question that actually pays the bills, did any of this lead anywhere. Track all five together and each one gives context to the others, a clicks increase with flat conversions tells a different story than a clicks increase with conversions rising alongside it.
Piling on every available metric just buries the three numbers that actually matter under thirty-seven that don’t. A dashboard with forty charts gets ignored for the same reason a ten-page report gets ignored, nobody can find the part worth reading.
What “automated” actually means here
Claude Code has a real, documented headless mode, running it as claude -p with a prompt and getting structured output back, built specifically for scripted, non-interactive use. That’s the actual mechanism behind “automated” here, not something implied or hand-waved.
The real shape of it: a scheduled job, cron on a server, a scheduled task on Windows, or a GitHub Actions workflow if the whole setup lives in a repo, runs Claude Code headlessly on whatever cadence makes sense, weekly for most accounts. That run pulls fresh Search Console and Analytics data through the MCP connection covered in full in our guide on connecting Claude to your SEO stack , and updates the template’s data tabs with it. This page won’t repeat that setup here, go there first if the MCP connection itself isn’t running yet.
Setting up the automated refresh, step by step
Once the MCP connection’s live, the scheduled job itself needs to do four things, in order:
- Pull the latest GSC and GA4 data for whatever window makes sense, the last 30 days is a reasonable default.
- Check it against the last run, so the job doesn’t just append duplicate rows every time it fires.
- Update the data tabs with the new rows, in the same column structure the template already uses.
- Log what changed, a short note of what got added, so there’s a record if something looks off later.
On our own test run, using the same dummy coffee-shop-review-site data as the rest of this cluster, Claude Code pulled three months of GSC and GA4 data, wrote it into the matching columns, and the Trends tab picked it up immediately since it’s built on formulas, not hardcoded numbers. No manual recalculation step, no copy-paste.
A few things worth getting right before this runs unattended. Keep the scheduled job’s permissions narrow, read access to Search Console and Analytics data only, it doesn’t need write access to anything else in the account. Keep a log of every run somewhere separate from the template itself, so a bad run’s easy to spot and roll back rather than silently overwriting good data with a broken pull. And test it manually a few times on a schedule before trusting it to run completely unwatched, the first few runs are where a wrong date range or a missed column mapping shows up.
Prompts to run this yourself
Six real prompts, matching the four steps above plus two worth having on hand. Copy them, swap in the bracketed details, and run them through Claude Code once the MCP connection to Search Console and GA4 is live.
- Pull the latest data
Connect to Search Console and GA4 for [site]. Pull the last 30 days of query, page, clicks, impressions, and position data from Search Console, and landing page, sessions, and conversions from GA4. Format each as rows matching the GSC Data and GA4 Data tabs in [template file].
- Check it against the last run
Here are the current GSC Data and GA4 Data tabs from [template file]. Compare the data you just pulled against what’s already there, and only keep rows for dates that aren’t already present, so nothing gets duplicated.
- Update the data tabs
Add the new, deduplicated rows to the GSC Data and GA4 Data tabs in [template file], keeping the exact column order and the Month formula in column B. Leave the Trends and Overview tabs alone, they update automatically from the formulas already in place.
- Log what changed
Write a short, plain-English summary of this run: how many rows got added, which dates they cover, and anything that looks unusual, a value well outside the recent average. Save it as a dated log entry rather than just printing it out.
- Flag anomalies before anyone opens the dashboard
Compare this run’s new data against the last three months in the Trends tab. Flag anything that moved more than 20% in either direction, and name the metric, the month, and whether it’s clicks, impressions, position, sessions, or conversions.
- Write the scheduled script itself
Write a script that runs Claude Code headlessly through prompts 1 to 4 in sequence, on a schedule triggered by cron or a scheduled task. Include basic error handling, so a failed data pull doesn’t overwrite good data with an empty or partial result.
None of these replace checking the output the first several times a run happens. Treat the log from prompt 4 as something to actually read for the first month, not just a file that exists in case something goes wrong later.
What this doesn’t replace
An automated dashboard shows what changed. It doesn’t explain why a metric moved, or decide what to do about it, that’s still a person’s job. A drop in average position could be a genuine ranking problem or a seasonal dip that resolves itself in a month, the dashboard shows you the number moved, working out which one it is still needs someone who knows the account.
And a dashboard that updates itself but nobody’s actually looking at is exactly as useless as a manual one nobody opens. Automating the refresh solves the tedious part. It doesn’t solve the part where someone has to care about what the numbers say.
Take the example numbers above. Conversions jumped 60% month over month, the biggest move on the whole sheet. A dashboard just shows that number. It takes a person to check whether that’s a real trend worth building on, a one-off spike from a single good week, or a tracking issue inflating the count, before anyone decides to act on it.
FAQs About About Free SEO Dashboard Template with Claude
Do I need to know how to code to set this up?
Not to use the template itself, that’s a normal spreadsheet. Setting up the automated refresh needs someone comfortable running a scheduled script, or willing to hand the prompts above to someone who is. The template works fine on its own with manual exports if that’s not worth it yet.
Can I use the template without automating anything?
Yes. Paste a GSC and GA4 export in by hand whenever you’re due to report, and the Trends and Overview tabs still update themselves from the formulas. Automation just removes the manual export-and-paste step, it isn’t required for the template to work.
How often should the dashboard actually update?
Weekly’s a reasonable default for most accounts, often enough to catch a real problem early, not so often that every normal fluctuation looks like a signal worth reacting to. Daily makes sense for a high-traffic site tracking something time-sensitive, monthly’s fine for a slower-moving account.
Can I add more metrics to the template?
Yes, the GSC Data and GA4 Data tabs take extra columns fine, just update the Trends and Overview formulas to reference them. Keep the core five as the ones checked first though, extra metrics are worth adding for a specific reason, not just because the data’s available.
Is it safe to run real client data through Claude Code like this?
Keep the scheduled job’s access read-only and scoped to the Search Console and GA4 properties it actually needs, nothing wider. The same caution that applies to any automated script handling client data applies here, this isn’t a Claude-specific risk.
Where this fits
Setting this up once is an afternoon’s work. Keeping it running, and actually acting on what it shows every week across every client on the books, is the part that turns into a resourcing question. If you’d rather have that run properly, that’s what our AI SEO Dubai service is for.
Not ready for that conversation yet? Run your site through the free SEO & AI Visibility Audit first and see where you actually stand.
Sources cited
- Semrush Keyword Analytics: seo dashboard template with claude, free seo dashboard with claude, how to make an seo dashboard with claude (all 0 recorded volume), plus supporting terms seo reporting dashboard, automated seo reporting, seo dashboard template, free seo dashboard, claude code seo, US and AE databases, pulled 2026-07-31.
- Anthropic, Claude Code documentation — referenced for the real, documented headless/scripting mode (-p flag), not re-explained in full here.